by Dominic Cope, on November 1, 2010
Industry Use Cases
Exosite's ExoSense®️ Condition Monitoring Application and Murano IoT Platform enable organizations to deliver services and solutions for industries with high value assets, equipment, sensors, and machines.
Customers
Learn how other Organizations have leveraged Exosite.
Condition Monitoring & Insight
ExoSense
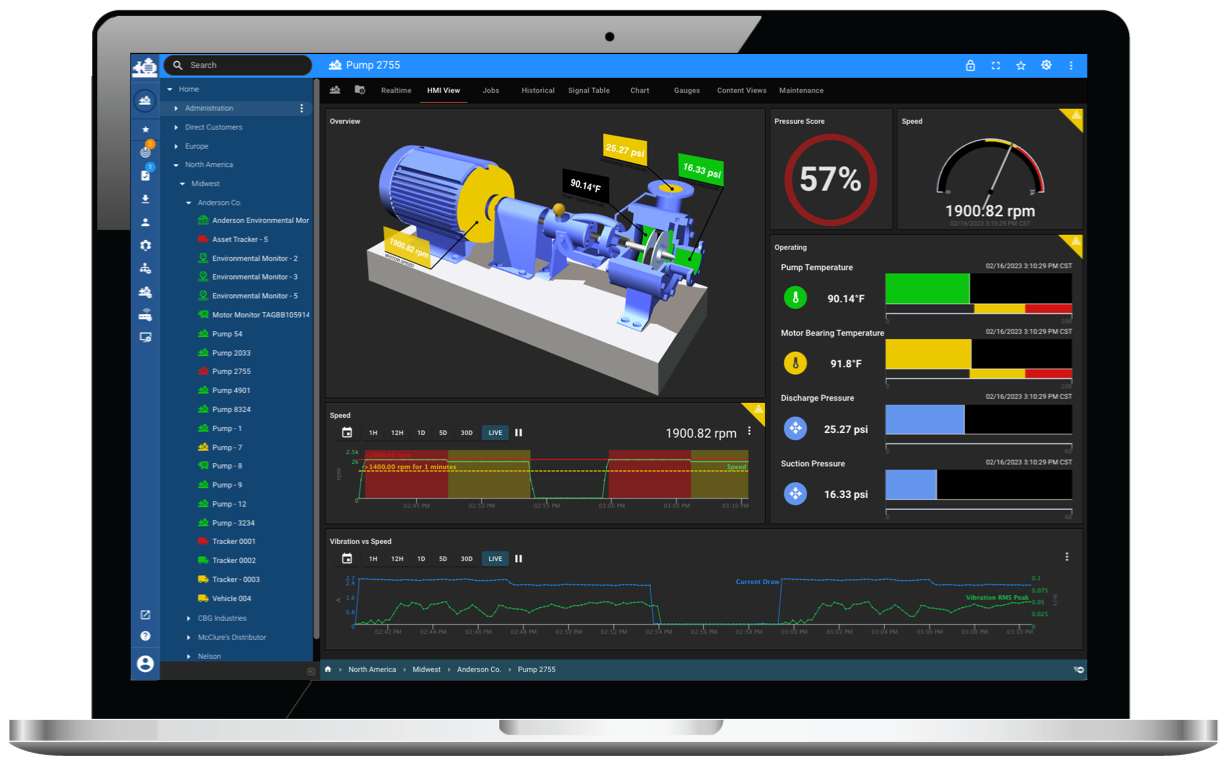
Condition and Remote Monitoring application for insight into your equipment, machines, and processes. Get started today by deploying your own monitoring solution on top of Exosite's Industrial IoT Platform.
Industrial IoT Platform
Industrial IoT Platform
Exosite's Scalable, Secure, Industrial IoT and Data Platform for Connectivity, Management, Deployment, and Application Enablement.
Enterprise
Dedicated Cloud
Managed Enterprise Industrial IoT Platform
On Prem
Industrial IoT Platform On Prem
Industry Use Cases
Exosite's ExoSense®️ Condition Monitoring Application and Murano IoT Platform enable organizations to deliver services and solutions for industries with high value assets, equipment, sensors, and machines.
Customers
Learn how other Organizations have leveraged Exosite.
Condition Monitoring & Insight
ExoSense
Condition and Remote Monitoring application for insight into your equipment, machines, and processes. Get started today by deploying your own monitoring solution on top of Exosite's Industrial IoT Platform.

Industrial IoT Platform
Murano Industrial IoT Platform
Enterprise Scalable, Secure, Industrial IoT and Data Platform
Enterprise
Dedicated Cloud Murano
Managed Enterprise Industrial IoT Platform
On Prem Murano
Industrial IoT Platform On Prem


