


by Exosite, on October 31, 2013
Welcome, ghouls and banshees, to Exosite's spooooky Halloween performance report! Prepare to scream and quake as you read all of our hair-raising aggregate statistics and bone-chilling – Y'know what? I can't keep this up. Let's start over.
Here we go with the first entry in a new series on web performance that we announced last Wednesday. We're psyched to bring you some hard numbers on the current Portals user experience and point out some areas we're going to target for improvement. I put together this post with the help of Dan Weaver, our Senior Software Developer, and we both really love numbers.
To get a sense of our system's overall performance, we picked out a few of the most frequently visited pages in Portals. Then we ran each page through multiple trials on the invaluable, magnificent WebPagetest. We love WebPagetest almost as much as we love numbers. The pages we chose for testing are:
- Login: The login page is often the first thing you see. The faster it loads, the sooner you can start getting stuff done.
- Data: This page is meant to provide a quick overview of the data being reported by your network of devices. Emphasis on "quick."
- Devices: An overview of your deployed devices. We want this page to load zippily whether you have 6 devices or 106.
- Dashboard: Dashboards are the flagship feature of Portals. No matter how you choose to slice and dice your data, dashboards enable you to see it all at a glance.
So what did we find?
Overall Stats
We ran our tests, through WebPagetest, on a Thinkpad in Dulles, VA running Google Chrome over a DSL connection. And here are the results:
| Page | Median First-Load Time (ms) | Median Repeat-Load Time (ms) |
|---|---|---|
| Login | 1 898 | 1 885 |
| Data | 2 095 | 2 241 |
| Devices | 1 867 | 1 566 |
| Dashboard | 1 077 | 1 031 |
There's one point that these numbers really drive home: our pages really aren't loading any faster on subsequent loads than they do at first. Right away, we see some low-hanging fruit that can greatly improve the Portals experience: making sure we tell browsers to cache every asset they can cache.
Currently, whenever you load a Portals page, your browser has to go and re-download each image and stylesheet and javascript document referenced by it. This happens even if those things haven't changed since you last downloaded them, which is almost always the case. That's easy to fix! All we have to do is identify our static resources to the browser, and it will use its own copies whenever it can. That way, pages will load much faster if you've used them recently.
Now let's get down to the nits and grits, by discussing how we search for page-specific optimizations.
Methodology
We can learn all sorts of things from WebPagetest, and the richest tool it gives us is the Waterfall View. This diagram shows each HTTP request made when loading the Portals app broken down and color-coded by the type of activity happening at each time:
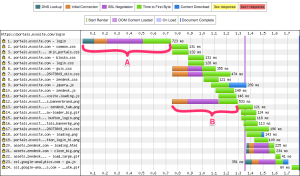
Requests like A and B are the ones we really need to go after. That initial request, A, breaks down like so:
- DNS lookup: 95ms
- Initial connection: 106ms
- SSL negotiation: 293ms
- Time to first byte: 229ms
The real killers here are SSL negotiation (293ms) and time to first byte (229ms).
SSL negotiation shouldn't require more than 2 round trips between the client and the server, so there's no good reason that we shouldn't be able to get it arbitrarily close to twice the initial TCP handshake time (106ms * 2 = 212ms). We're going to look at ways to tune our server's SSL negotiation performance, and hopefully rake in some dividends in the form of a narrower waterfall.
The other main bottleneck, and the one that appears in all of the browser's requests, is the Time to First Byte (TTFB). TTFB is a much more slippery fish. First we'll need to find out where the extra time is being spent; the server could be database callouts, HTTP callouts to other services, or simply crunching numbers. Once we understand the nature of the delay, we can begin to address it appropriately. Expect some details about – and some reductions in – this TTFB number in next quarter's Performance Report!
And while we're talking about the TTFB, it's important to note that only a few of these requests require server-side processing and callouts. A lot of them are static (CSS stylesheets, images, Javascript documents, and so on). This means our performance could benefit a great deal from distributing these static assets to a content delivery network or CDN. A CDN is a network of web servers optimized for static content and distributed all around the world. They help reduce both your initial connection and SSL negotiation times (simply by being physically and virtually closer to the user) and TTFB (by being single-mindedly tuned for blazing-fast response times).
Looking Forward
I think we're going to have some really good stuff to show you next quarter. Our engineers are going to dig into each of these performance bottlenecks, and our next report will give some direct comparisons to show you exactly what effects our work has had. And in the meantime, look for some upcoming technical posts detailing about specific hacks and tweaks that we find along the way.
Here's to snappiness!