Diagnostic IoT Analytics: Why Did It Happen?
by Exosite, on April 19, 2016
In last week's breakdown of the Data Analytics for IoT white paper, we looked at descriptive analytics. Understanding what happened in an organization's IoT analytics is an important first step. Following what happened, an organization must understand why it happened.
Upon digging deeper into the data provided by descriptive IoT analytics, it is possible to see that failure or unexpected behavior of a device is often linked to an anomaly in its behavior before the event. What state was the IoT connected device in when the fault occurred? What may have contributed to the fault? Is different data needed to make a more accurate assessment of why the device failed?
Diagnostic analytics tell us what previous device behavior likely caused or indicated its behavior. This can be as simple as identifying that an abnormally high value for one metric, or a combination of metrics, typically preceded a specific device behavior.
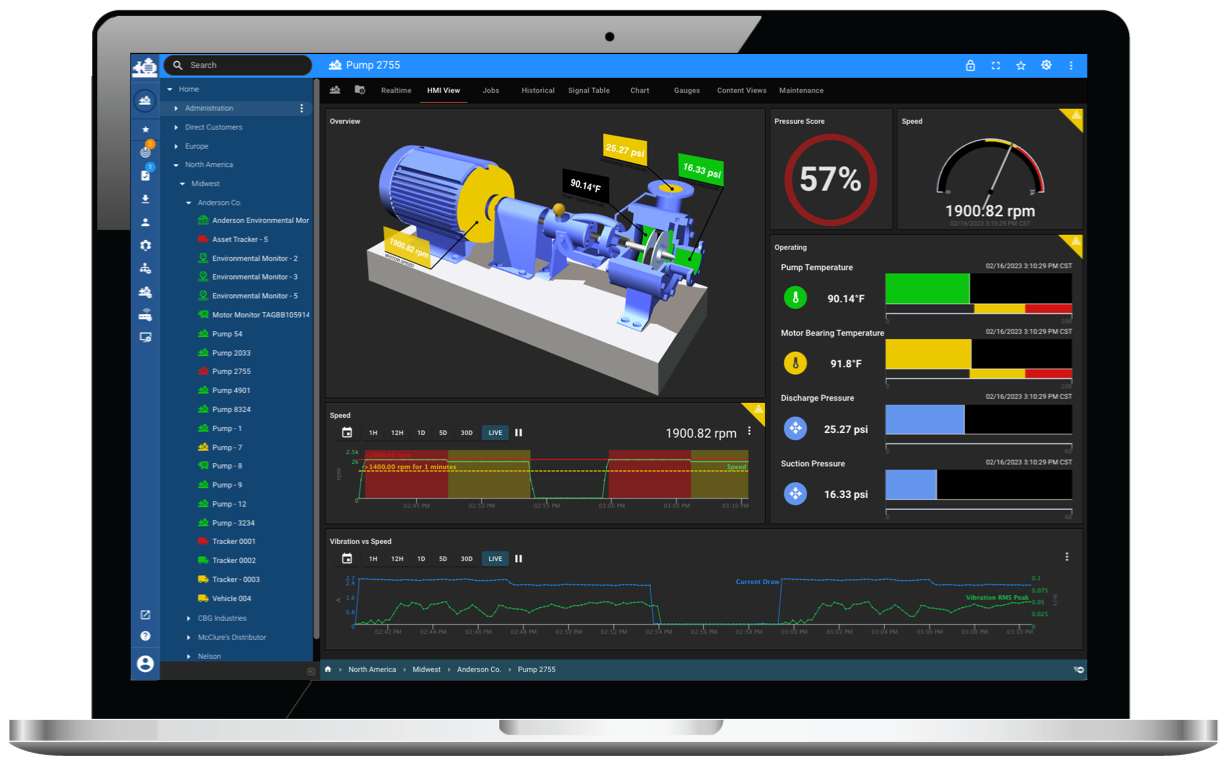
Continuing with the industrial pump example above, vibration is one of the most prominent causes of pump failure. Vibration can be caused when a bearing fails, or when a pump is subjected to a shock that it was not built to withstand. Diagnostic analytics could easily link the descriptive statistics of an increase in vibration to the eventual failure of a pump, as long as pump vibration is being monitored. This type of diagnostics would allow technicians to take actions to limit vibration going forward or to request that higher vibration thresholds be incorporated into future pump designs.
If the cause of a device's failure cannot be diagnosed from descriptive statistics, this is a sign that more information needs to be collected, which could mean obtaining additional metrics or sampling data with higher granularity. Download the full white paper for IoT insight or contact us directly to jump start your IoT solution today.


