Predictive IoT Analytics: Projecting Future Device Behavior (Part 3) Classification
by Exosite, on June 21, 2016
Following our previous IoT analytics blog segment, this series continues to break down key predictive analytic features and this week focuses on data classification. Classification is one of the most applicable concepts to IoT solution providers when trying to predict device failure. Classification entails grouping device behavior by outcome into buckets, the number of which varies based on the specific application. To continue the elevator example referenced in previous analytic blog segments, cluster analysis suggested that elevators maintenanced within a certain time frame will have more downtime than is preferred. However, when one elevator is being repaired or replaced, one or more of the other elevators will have increased runtime, sometimes beyond the preferred thresholds. This would be cause for concern if an elevator was serviced more than twelve months ago, but otherwise is not a problem. A classification algorithm is capable of taking all of these variables (and many, many more) into consideration and can notify the appropriate party in the event that a combination of variables is met that indicate significant downtime could be imminent. By dividing these outcomes into different behavioral buckets, unexpected downtime and loss of time, money, and customer satisfaction can be avoided.
PUMP VIBRATION LEVELS AND FAILURE RATES
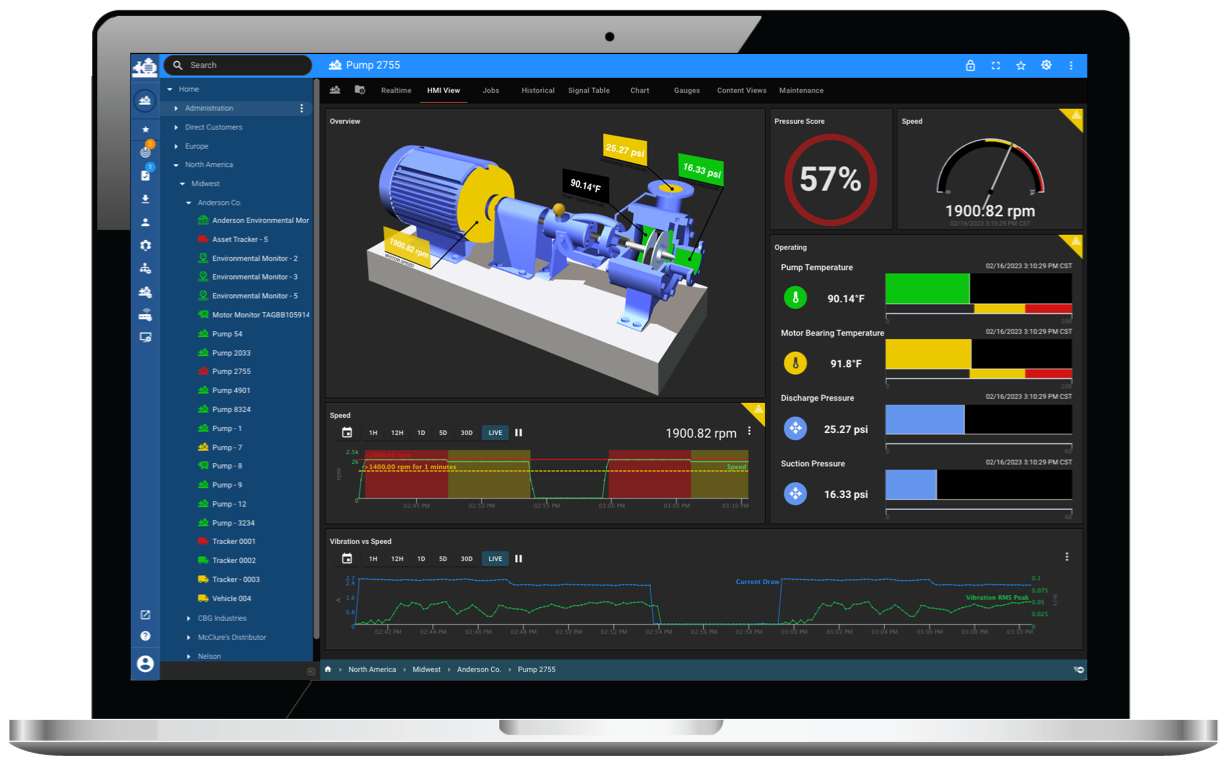
In industrial IoT platform applications of predictive maintenance, it is common to simplify classifications into two buckets. To discuss this, consider a more detailed example based on an industrial fluid pump. For this product, the two classification buckets might be pump will fail and pump will not fail. Through diagnostic analysis, it is possible to determine that excessive pump vibration as monitored through a sensor on the pump is the most common cause of failure. Based on this comparison, vibration level alone clearly does not predict device failure. Abnormally high vibration has several causes and, although most pump failures are caused by high vibration, not all high vibration is an indicator that a pump will fail. This suggests that additional pump metrics should be considered. This can be cured by adding a second sensor to the pump, temperature. Now we can compare average vibration amplitude and average temperature over a period of time. (Download full Data Analytics for IoT white paper for data table examples)
PUMP VS. TEMPERATURE
When the temperature dimension is added, it is clear to see that high pump vibration level coupled with high temperature is an indicator of pump failure. However, it then becomes less obvious about how to explain the data points in the grey area. In order to do this, it may be useful to consider additional pump information. Say that excessive pump vibration is most commonly caused by bearing failure for a certain application. Further, if a bearing on a pump goes out, more friction, and thus heat, will be introduced to the system. If pump vibration is the only variable taken into consideration, a pump may be considered likely to fail because the vibration amplitude is above the typical range. However, if pump temperature is within its normal range, a bearing likely has not failed and the pump should not be predicted to experience downtime. Increasing the sophistication of predictive models so that they take into account multiple variables and internal product knowledge can help avoid such false positives. However, the more variables that are added to the mix, the more complex the logic behind predicting failure becomes. For these logical, decision-making processes to be automated, it is necessary to build classification trees and encode them into predictive maintenance algorithms. (Download full Data Analytics for IoT white paper for data table examples)
PUMP CLASSIFICATION TREE
Using three dimensions, vibration, time since last serviced, and temperature, the classification tree segments connected product behavior into the buckets of pump will fail and pump will not fail. Typically, the simple model just created would be built by intensive statistical learning processes that create hundreds or thousands of models and find one with the best fit. However, the best fit for 100 IoT connected products on one site might not be the best fit for 250 pumps at another. One of the primary dangers in using statistical techniques to construct a classification tree is overfitting. Overfitting occurs when a set of data is used to develop a classification of device behavior and the model is built to resemble that particular set of data as closely as possible. (Download full Data Analytics for IoT white paper for data table examples)
RANDOM FORESTS
Random forests are useful in combatting overfitting. A random forest involves the construction of many classification trees built on many subsets of a sample data set and averaging their results. This provides much more stable predictive power than an overfitted model does. As random forests frequently contain over 100 trees, it is outside the scope of this paper to discuss them in detail here. For a complete description of the analytic classifications, download the full white paper or Contact Us to kick-start your IoT solution.


